Before I Lose Real Money, I Ran Some Numbers
Author
Hector C. Ortiz
Date Published

Everyone has that one friend who says "I've been thinking about algorithmic trading." I am that friend. And unlike most of them, I actually ran the numbers before losing any real money. You're welcome, future me.
I coded up a trading algorithm and ran it thousands of times across hundreds of stocks. The algorithm is, to use the technical term, bad. If it weren't, I'd be writing this from a penthouse in Miami instead of wherever I currently am. But the experiment was valuable, and the data revealed some genuinely surprising insights, so stick with me.
The Methodology
I pulled 101 stock tickers per sector across all 11 sectors of the market. Why 101 and not a round 100? Because I made a typo when writing the download script and grabbed one extra by accident and throwing it away felt wasteful. So, 101 it is.
This is how real quantitative research happens.
With 1,111 stocks downloaded I coded up a trading algorithm and ran it 1,000 times for each of six different portfolio sizes, picking 10, 12, 14, 16, 18, and 20 random stocks per sector each run. The goal? To figure out whether a bigger portfolio actually does anything useful, or if I'm just collecting stocks like sad Pokémon cards.
Does Portfolio Size Actually Matter?
Short answer: kind of. Long answer: not in the way you'd hope, but in a way that might help you sleep at night.
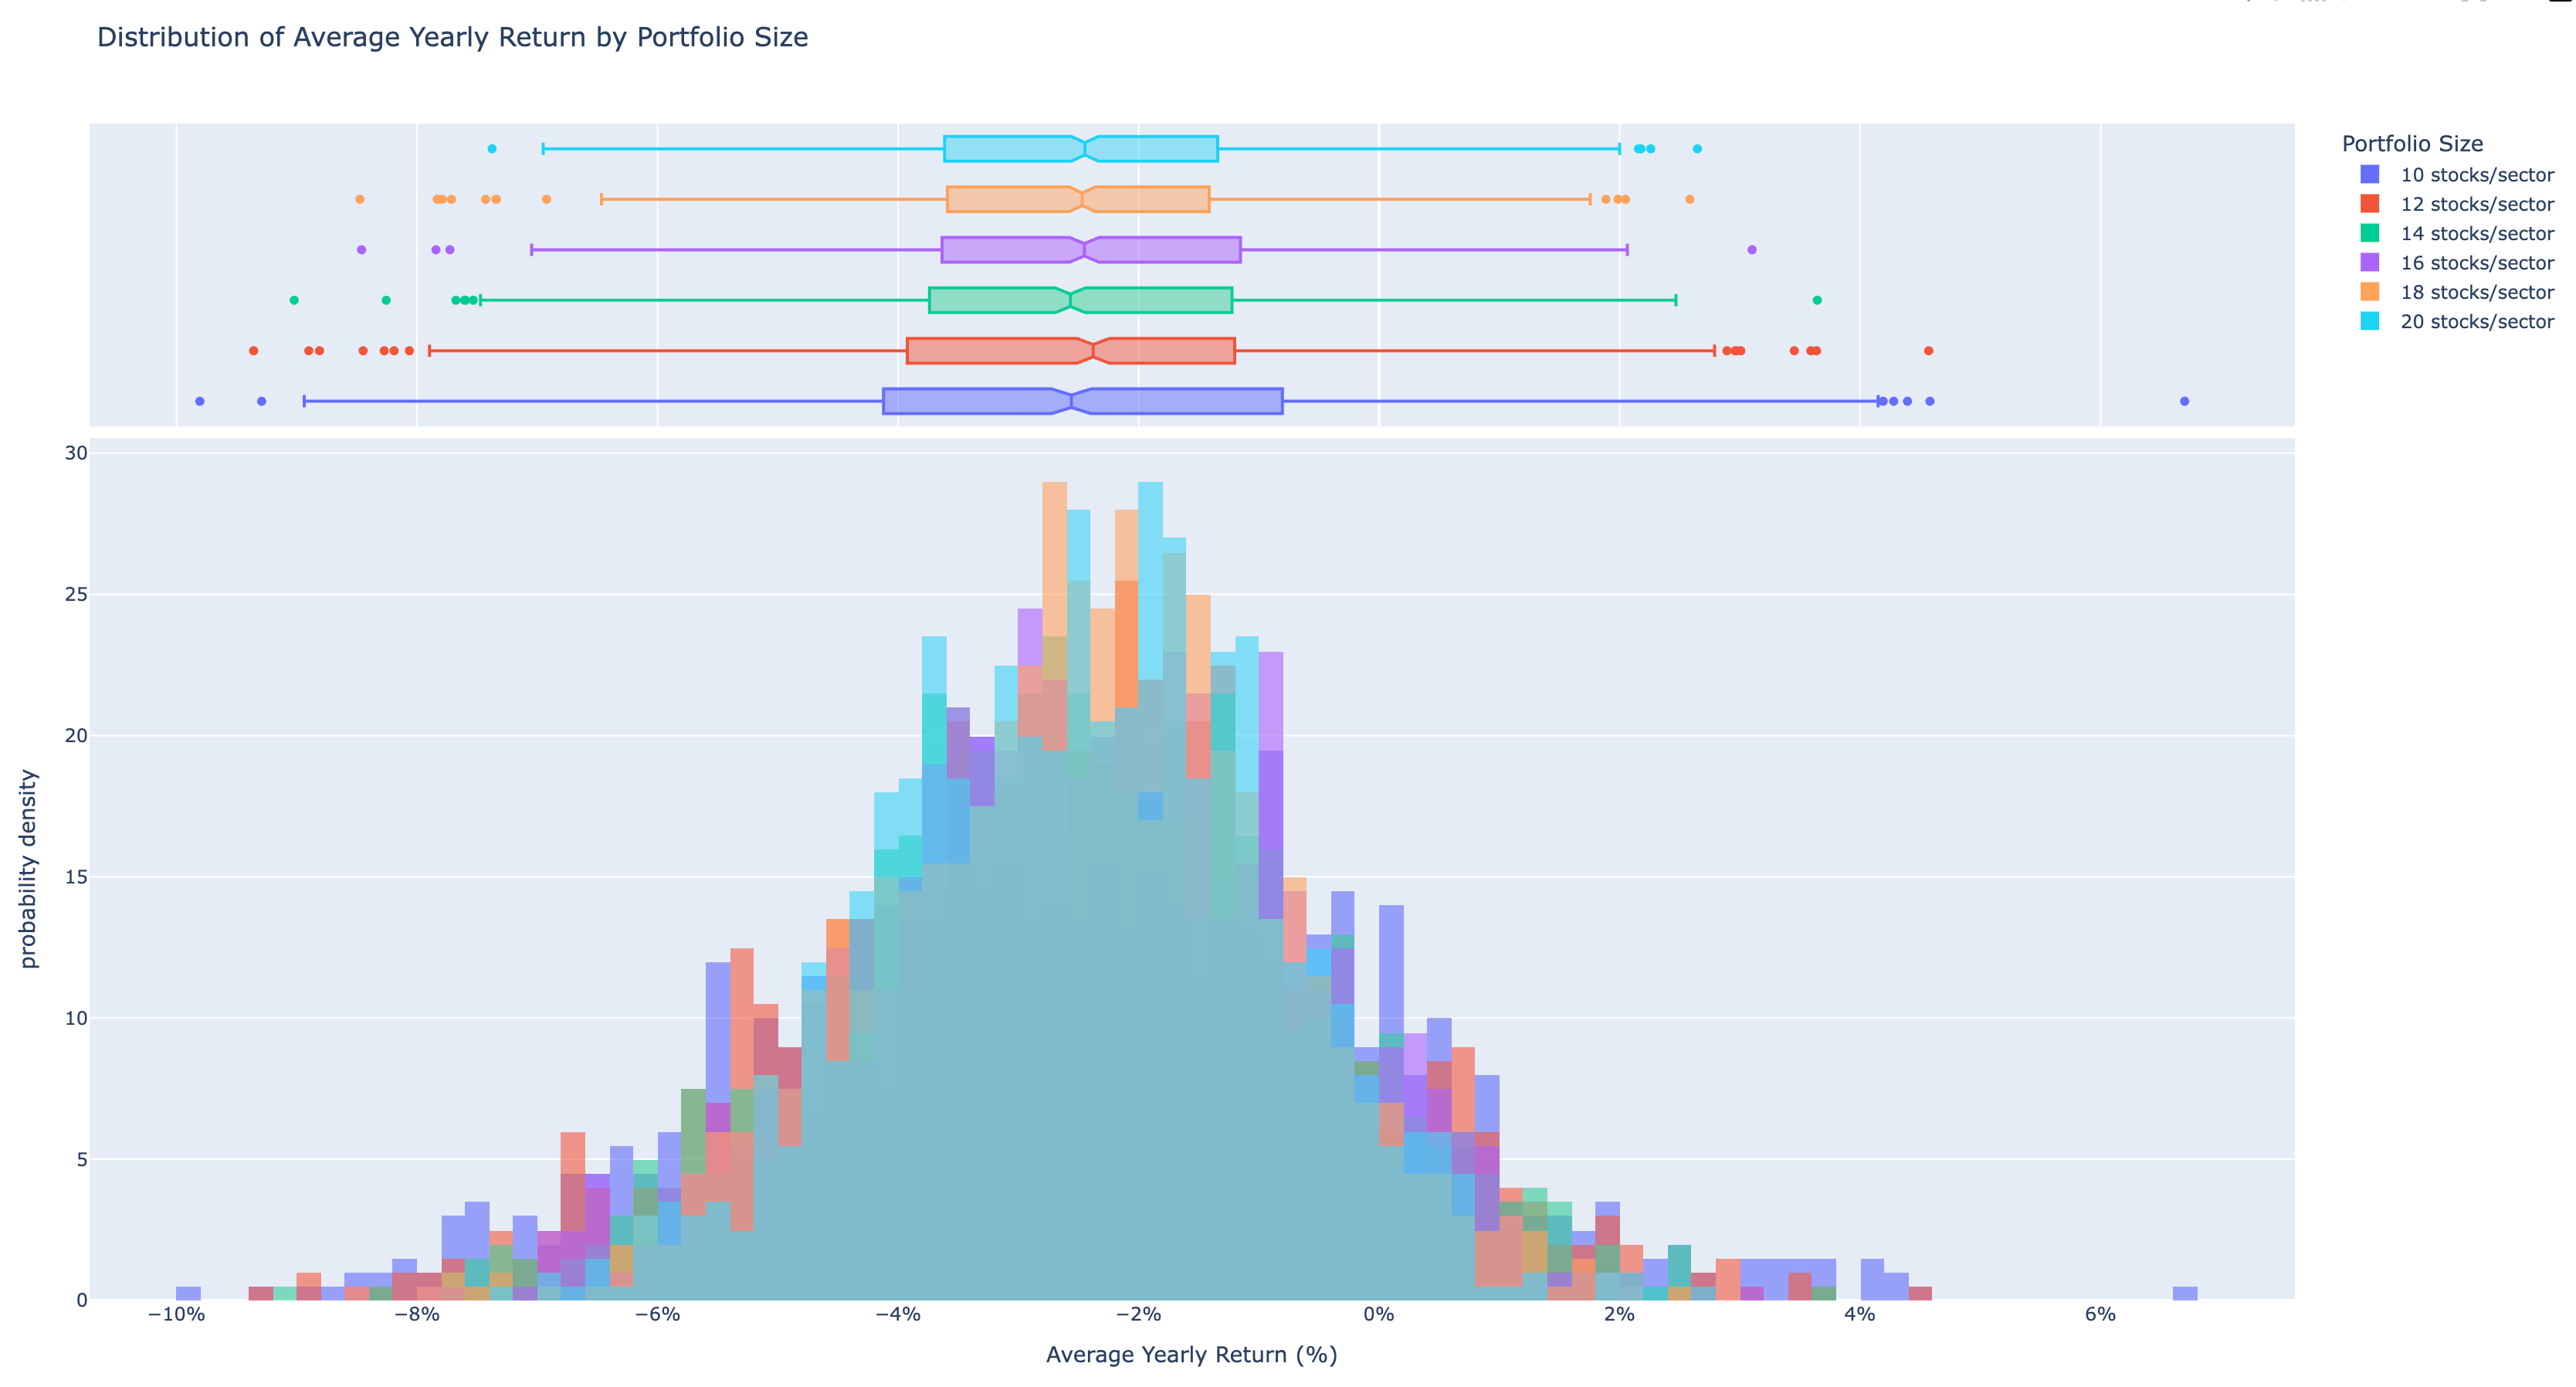
When it comes to raw returns, the algorithm was consistent across portfolio sizes. We're talking from -2.5%/year for a 110-stock portfolio up to a blistering -2.4%/year for a 220-stock portfolio. Yes, a 0.1% improvement. Break out the champagne.
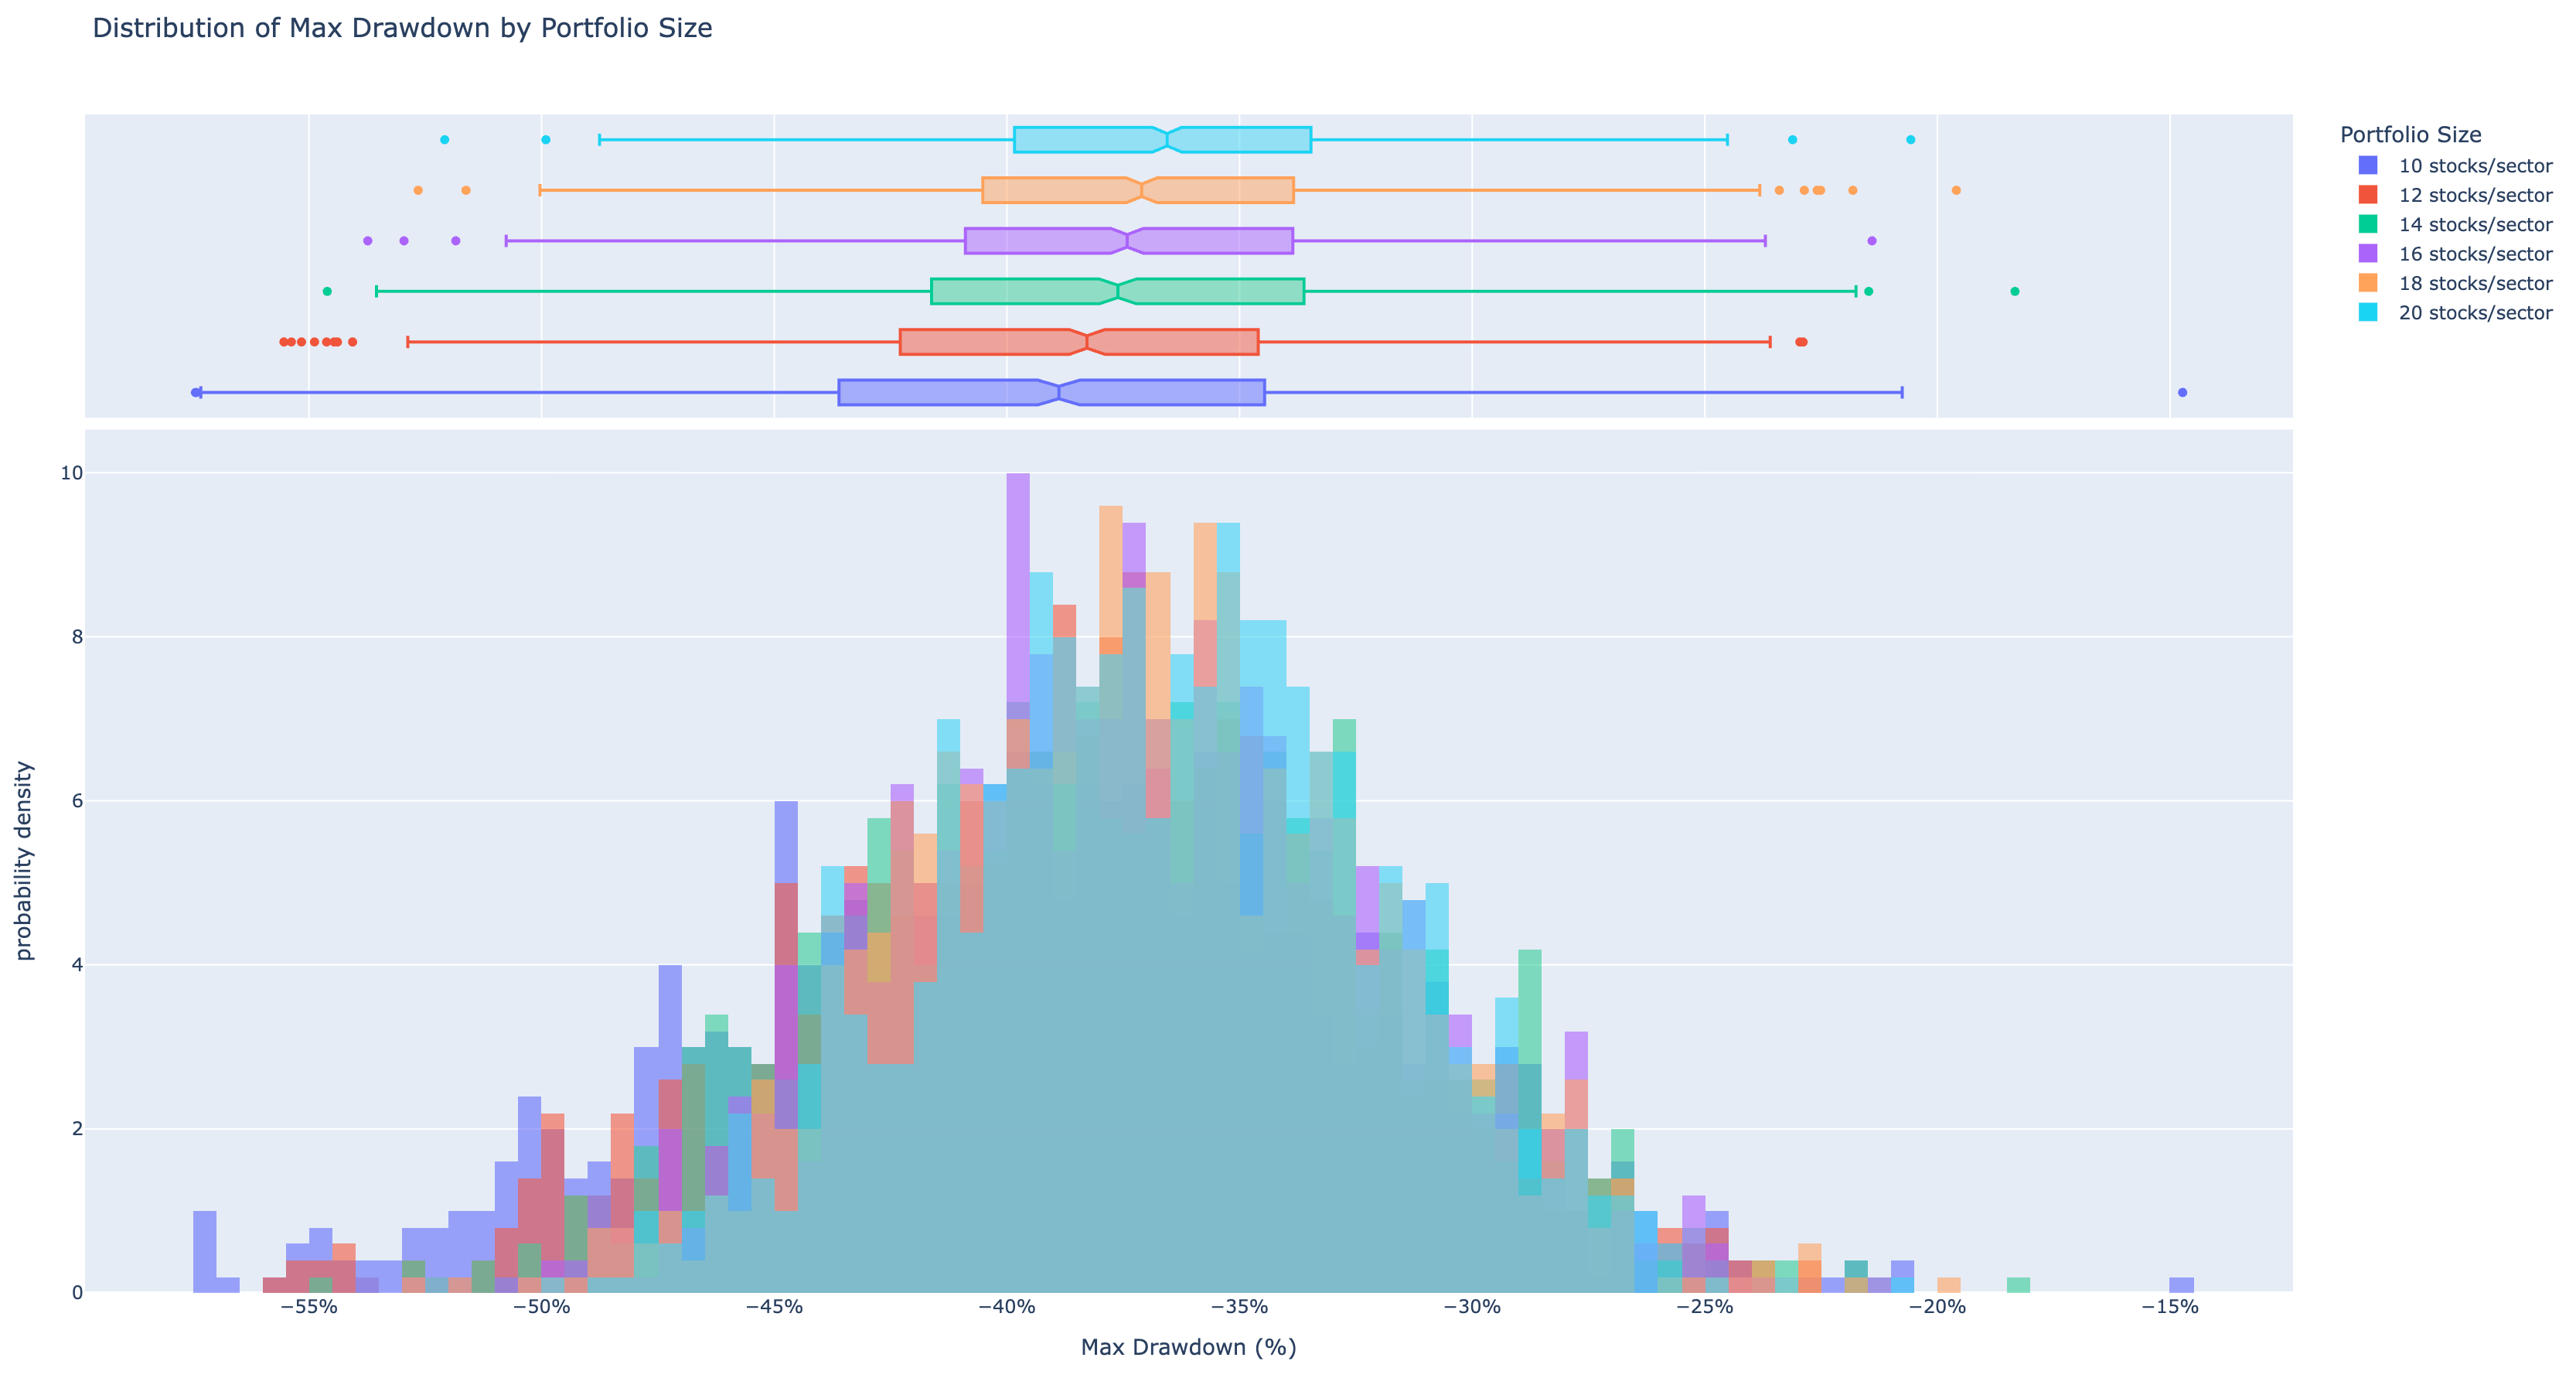
But here's where it gets interesting. While returns barely budged, the maximum drawdown (the worst peak-to-trough drop your portfolio takes) improved meaningfully with size. From 38.9% down to 36.6%. That's a 2.3% improvement.
2.3% might not sound like much, but when you're managing serious capital, it's the difference between a normal Tuesday and a 3am call from your risk manager.
The Correlation Plot Twist
Here's something that sounds obvious once you hear it: if all your stocks move together, they'll also crash together. Correlation measures exactly this, how in sync your stocks are. High correlation means your portfolio goes up as a group, which feels great,. But, it also means it goes down as a group, which is less fun when you're watching your net worth do a synchronized nosedive.
The question I wanted to answer was simple: does correlation actually impact returns, or is it just something finance people say at parties to sound smart?
So I ran the algorithm two ways: once with the most correlated stocks per sector, and once with the least correlated. The results?
- Correlated portfolio: -1.8% average annual return. 40.0% max drawdown.
- Uncorrelated portfolio: -2.0% average annual return. 26.1% max drawdown.
Returns? Basically identical, a 0.2% difference, well within "who cares" territory.
But the max drawdown told a completely different story: 13.9% better in the uncorrelated portfolio. Same lousy returns, dramatically less chaos on the way there. Turns out correlation doesn't move the needle on what you make, it just determines how much you suffer in the process.
So What Does All This Mean?
Look, I'm not going to pretend the algorithm is good. A -2% annual return means that if I had just put this money in an index fund and gone on vacation, I'd have done significantly better.
But the experiment was valuable. Here's what I actually learned:
Portfolio size matters for risk, not returns. Going from 110 to 220 stocks didn't fix the algorithm's returns, but it meaningfully reduced how badly the portfolio could crater on a bad day. If you're going to be wrong, at least be robustly wrong.
Correlation is a risk lever, not a return lever. Picking uncorrelated stocks didn't hurt returns. But it slashed the maximum drawdown by nearly 14 percentage points.
Next up: actually fixing the algorithm. The journey to beat the market continues, data in hand, ego lightly bruised, and one accidental extra stock in the dataset.
More to come. Same chaotic methodology. Better (hopefully) results.
* No real money was harmed in the making of this analysis. A significant amount of compute time was.